
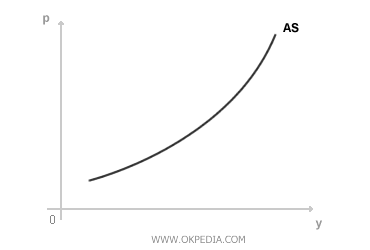
AS Curve
The AS curve represents aggregate supply on a Cartesian graph. It shows the total output (y) produced by firms within a given economic system as it relates to the price level (p). The curve is constructed by summing the supply curves of individual firms. On the graph, the AS curve illustrates the positive relationship between output (y) and price (p). Its graphical representation is shown below:
The AS curve (aggregate supply curve) plays a crucial role in the AD-AS model, where it helps determine the level of output supplied by firms (y) as the price level (p) changes. Its construction reflects firms’ production decisions, which aim to maximize profit. These decisions depend on factors such as the production function (technology), input costs, and product prices. Mathematically, the AS curve can be represented by the following formula:
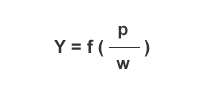
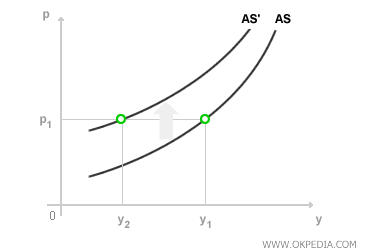
The formula captures the positive correlation between output (y) and price (p). As product prices rise, real wages (w/p) decrease, encouraging firms to employ more labor (L), which boosts output (y). However, as more inputs are used, diminishing marginal returns set in, explaining the AS curve’s convex shape. For instance, if all other factors remain constant, an increase in nominal wages (w) shifts the AS curve upward.
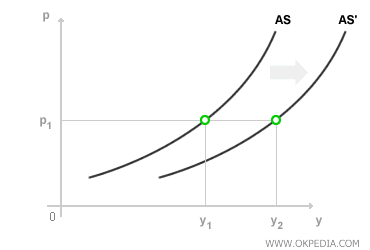
On the other hand, an increase in marginal productivity shifts the AS curve to the right. Higher marginal productivity of labor allows firms to produce more output with the same amount of labor (L). This rightward shift is often driven by the adoption of more efficient technology in the production process.

Constructing the Aggregate Supply Curve. The shape of the AS curve can be understood through microeconomic theory, as it represents the combined production decisions of individual firms. These decisions are guided by firms’ profit-maximization objectives.


