
Individual Demand
Individual demand refers to the quantity of a product that a consumer chooses to purchase based on its market price, personal preferences, and available income.
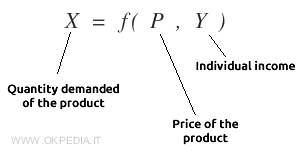
Here, income (Y) is held constant to focus specifically on the relationship between the quantity demanded (X) and the product’s price (P).
Generally, there’s an inverse relationship between the quantity demanded and the price of a product.
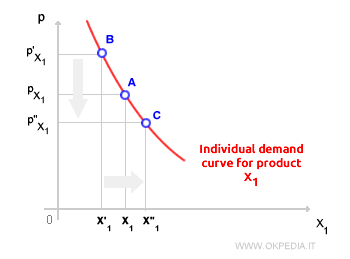
Example. When the price (P) of a product increases, the quantity demanded (X) by consumers typically decreases, and vice versa.
Graphing Individual Demand
Individual demand is depicted on a graph as a convex, downward-sloping curve on a Cartesian plane.
How to Plot the Individual Demand Curve
To construct the individual demand curve for a product, we start with the price-consumption curve.
What is the price-consumption curve? This curve shows the relationship between price changes in a product and changes in the consumer's optimal choice bundle.
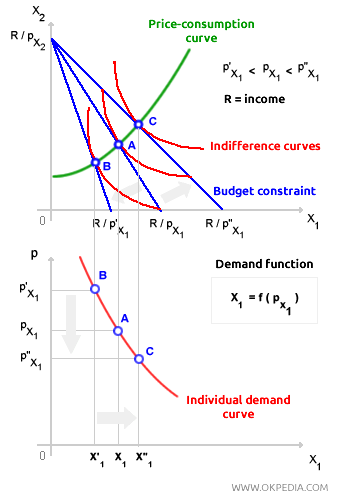
With income R fixed, the price PX1 of the product varies, allowing us to analyze how the quantity demanded of X1 changes.
The resulting quantities ( X'1, X1, X"1 ) are then plotted on the horizontal axis of the second diagram below.
What's different in the second diagram? On the vertical axis of the second graph, we measure the price PX1 of the product X1, whereas in the first diagram, the quantity purchased of the other product X2 is shown.
This creates points ( A, B, C ) on the second diagram with coordinates ( X, P ).
Connecting these points on the second diagram forms the individual demand curve for product X1.
This graphical representation allows us to analyze the relationship between price and consumption choices for a product.
Note. The same method can be used to construct the demand curve for the other product, X2.
Elasticity of Individual Demand
Depending on how sensitive demand is to price changes (demand elasticity), demand can be classified as either inelastic or elastic.
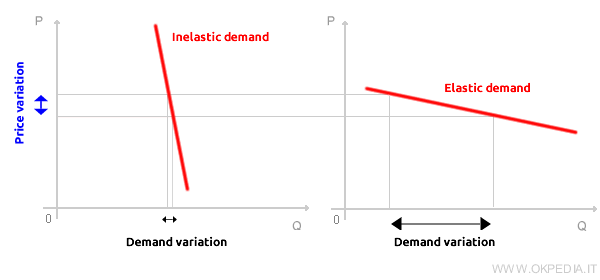
- Inelastic Individual Demand. Demand is inelastic when the quantity demanded doesn't change significantly with price fluctuations.
- Elastic Individual Demand. Demand is elastic when even a small price change causes a large shift in quantity demanded.
Limitations of Individual Demand
Individual demand provides a static and partial view of analysis.
It is a static analysis since it considers instantaneous changes (comparative statics) without exploring the transition path between equilibria.
It is also a partial analysis as it assumes all other economic variables (such as consumer income, prices of other products, preferences, etc.) affecting the quantity demanded remain constant.
Note. Individual demand is based on the restrictive assumption that demand for a product is solely a function of its price, while in reality, many other variables come into play.
The relationship between demand and price isn’t always inverse
The individual demand curve is typically downward-sloping due to the law of demand.
According to demand theory, there’s generally an inverse relationship between the quantity demanded of a product and its price.
When price (P) rises, the quantity demanded (Q) typically falls, and vice versa.
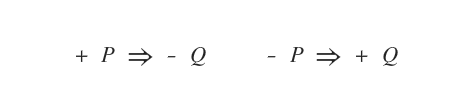
However, this relationship between demand and price isn’t always inverse.
For instance, with Giffen goods, the relationship is direct.
The Giffen Paradox. For Giffen goods, the opposite occurs. When the product’s price decreases, consumers reduce the quantity demanded. In this case, the relationship is direct.


