
Substitution Effect
The substitution effect describes the change in demand for goods resulting from a shift in their relative prices, without considering income effects. For two goods, X1 and X2, a change in the price of X1 alters their relative price ratio, calculated as PX2 / PX1. Graphically, a change in the price of one good affects the slope of the consumer's budget line. The diagram below illustrates the case of a price reduction, ΔPX1.
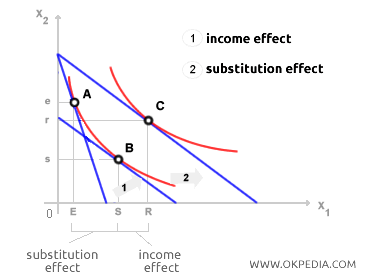
When PX2 changes, the relative price ratio PX2 / PX1 is adjusted, causing the slope of the budget line to shift. Assuming no other factors change, the consumer's optimal choice moves from the initial equilibrium point A to a new equilibrium point B. Both points lie on the same indifference curve, meaning the consumer's overall satisfaction or utility remains constant. From a demand perspective, the substitution effect is represented by the segment ES on the X1 axis and the segment es (in lowercase) on the X2 axis.
 The substitution effect is always negative because the quantity demanded of a good moves inversely to changes in its price. This principle also explains why indifference curves have a downward slope.
Income Effect. The substitution effect is only one of the two effects that occur following a price change. Price fluctuations also impact a consumer's real income (purchasing power) in addition to relative prices. A price decrease increases the consumer’s purchasing power, leading to greater demand for both goods. Conversely, a price increase reduces real income, resulting in lower demand for both goods. In the earlier graph, the income effect combines with the substitution effect, shifting the final equilibrium point from B to C.


